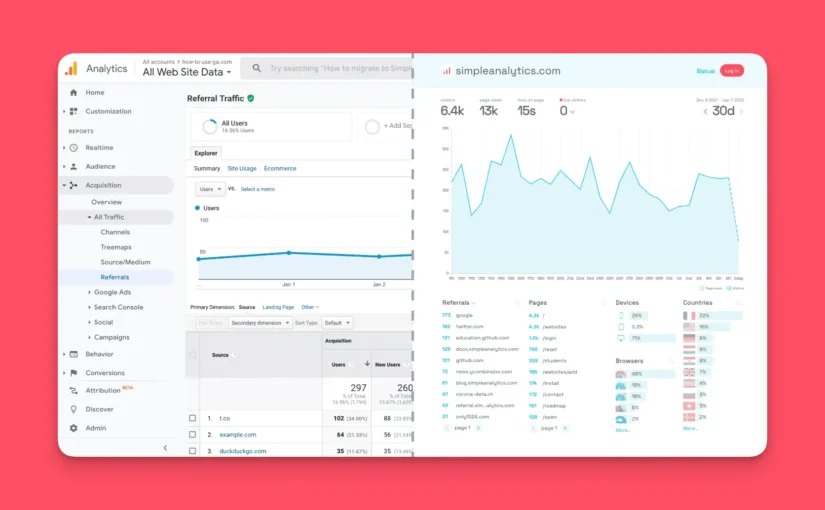
A German philosopher and book author who, throughout the last decade, was a regular guest in every German TV talk show that exists, often said this sentence about technology: “The measurable side of the world is not the world.”
Richard David Precht, who seems to become more handsome the older he gets, was of course right; it is not the world. But it is a world. A world that is driven by algorithms and metrics, by numbers, and that many people are connected to (maybe more than they should).
Keeping an eye on the results of these measurements, these numbers, is not only legitimate but also crucial to many businesses who depend on online traffic. But if you think about what tools can do this for you, to most, only one name comes to mind: Google Analytics.
Well, there’s more. Let me show you one.
Table of Contents
Keep it Simple
I’ve been into computers since I was about 14. I’m 34 now. During these 20 years, many things have changed—some for the better, some for the worse. One thing that hasn’t changed for a long time (at least for me) is the way I keep track of my website statistics.
Who visits what page at what time and when and how long do they stay—all this is data that offers a lot of insight and, if you know how to make the most of it, can be highly beneficial. In the case of online shops or SaaS websites, even financially.
The platform I’m talking about is, of course, Google Analytics.
But things have changed, and I can proudly say that I found an analytics tool that doesn’t require a Master’s in Statistics. Instead of Google Analytics, I now use Simple Analytics.
Transparency
At this point, I feel the ethical obligation to be transparent and mention that I’ve been approached by the team behind Simple Analytics to write a review about this tool. However, there are no guidelines of what I should or especially should not write—quite the opposite.
In the brief conversations, I’ve pointed out multiple times that this is not going to be a puff piece but an honest review that also contains criticism. The Simply Analytics team made it clear that this was totally fine, which in itself is part of great company ethics.
The Long Shadow of Google Analytics
Back to Google Analytics. GA has very clearly the highest market share when it comes to tools to gain more information on who your actual audience is and what drives them, or, even more important, what drives them not.
w3tech.com, a reputable website that surveys web technologies and took a look into GA’s usage on the web, makes this pretty clear with one quote:
Google Analytics is used by 82.5% of all the websites whose traffic analysis tool we know. This is 48.9% of all websites.
Not even the meteoric impact of generative AI kickstarted and long dominated by ChatGPT with its over 200 million users worldwide1 gets close to this number, despite the immense hype. As of November 2024, several websites claim2 that ChatGPT’s market share is somewhere between 60 and 70 percent of all AI tools.
So, with Google being the dominant force in several industries, it comes as no surprise that Google Analytics is the most used analytics tool on the internet today. But does that mean that ~80 percent of all website administrators love it? Definitely no. At least I don’t.
Introducing: Simple Analytics
Google Analytics has always felt way too much for my use cases. I’m sorry, I don’t run a Fortune 500 website; I develop medium-sized websites for clients, non-profit websites, and a whole lot of pet projects that rarely see the day of light. Simply speaking: I did not need everything Google Analytics has to offer—and it offers much, too much.
So, something simpler would be nice, I always thought, and when I went through GitHub’s Student Developer Pack, which hands out a ton of valuable services and tools for free, I stumbled upon Simple Analytics.
Privacy-friendly analytics with a simple interface and API.
That sounded nice.
Offer
Starter plan free for one year, including 100k page views per month.
That sounded even nicer.
“100,000 page views per month, I wish…,” I thought while I signed up on their website by connecting my verified student GitHub account. There’s no way any of my websites will have this amount of outreach, but that didn’t matter anyway. If I ended up not liking it, I thought, I could always switch back to the now not-so-attractive-anymore Google Analytics.
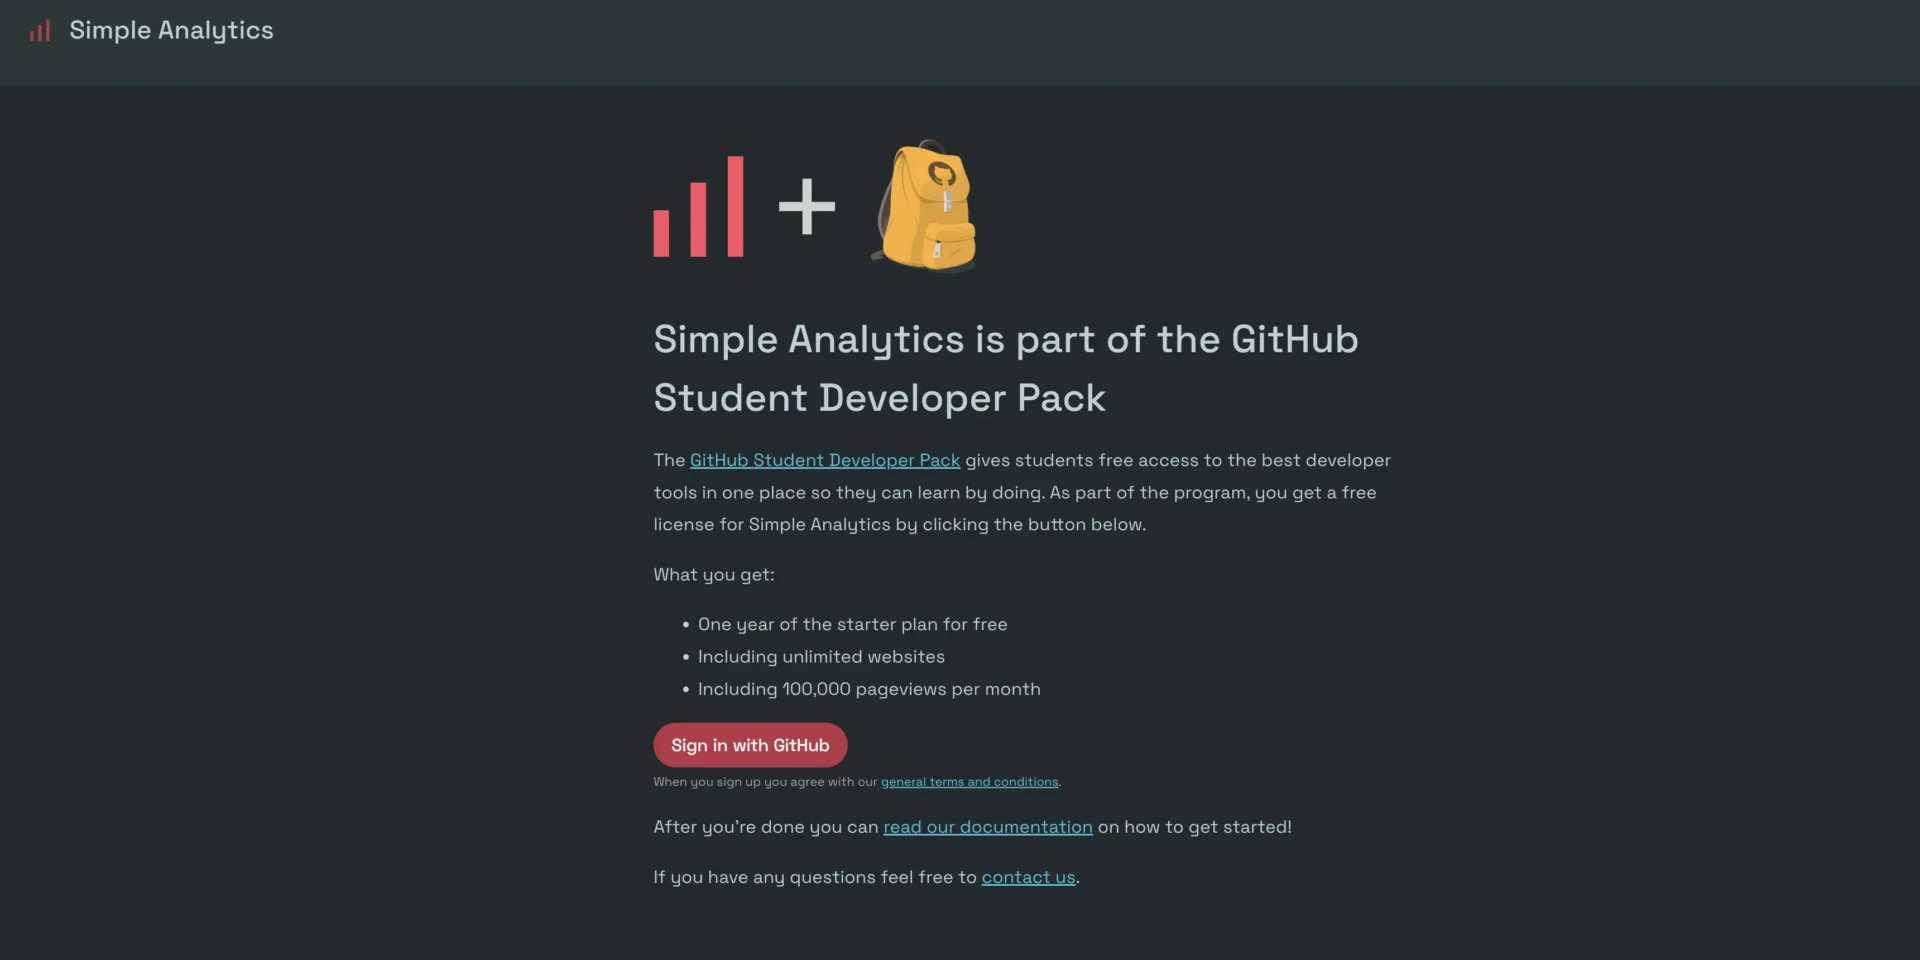
But before adding my first website, I wanted to get a clearer picture of Simple Analytics, whose abbreviation “SA” feels a little strange as a German national, had to offer.
The Promises
Just by having a brief look at their website, simpleanalytics.com, it becomes clear very quickly what the priorities of “SA” are. No, actually, it already becomes obvious by the name itself. Whatever.
Simple Analytics sells itself as a “privacy-first Google Analytics alternative.”3 The companies’ main focus is on privacy and simplicity. Among its main reasons to sum up why, at least in their view, “Simple Analytics is the best Google Analytics alternative,” it mentioned a few points that I just copied from their site (styles removed):
- Privacy protection is our business model. We comply by design with all privacy policies. Including: GDPR, PECR, CCPA and more.
- Simple UI. We give you the insights you need in an easy-to-use dashboard.
- Chat with AI and your analytics instead of digging through reports.
- We never, ever, ever store any personal data about your visitors. No cookie banners.
- Our Goals-tracker and Events Explorer lets you keep track of your most important events and conversion funnels.
- Our lightweight script increases your website speed.
The Requirements
As I’ve said in the beginning, my demand for complex analytical statistics is fairly limited. To be honest, the only things I care about the most are:
- Number of visitors (per day and timespan)
- Number of page views
- Live view of users visiting my website
- Referrers showing where on the web my users found my site
So, the bar is set already relatively low. I don’t think any other relatively established analytics tool out there would miss any of that, certainly not Google Analytics, but that doesn’t mean its implementations are user-friendly.
The Products
Simple Analytics is still first of all a business. Businesses offer products. And as with every other business, they charge for their services.
Looking at their “Pricing” page, you’ll see four plans: Free, Simple, Team, and Enterprise. You can get an idea of what price to expect for the “Simple” and “Team” plans by moving a slider with expected page views.
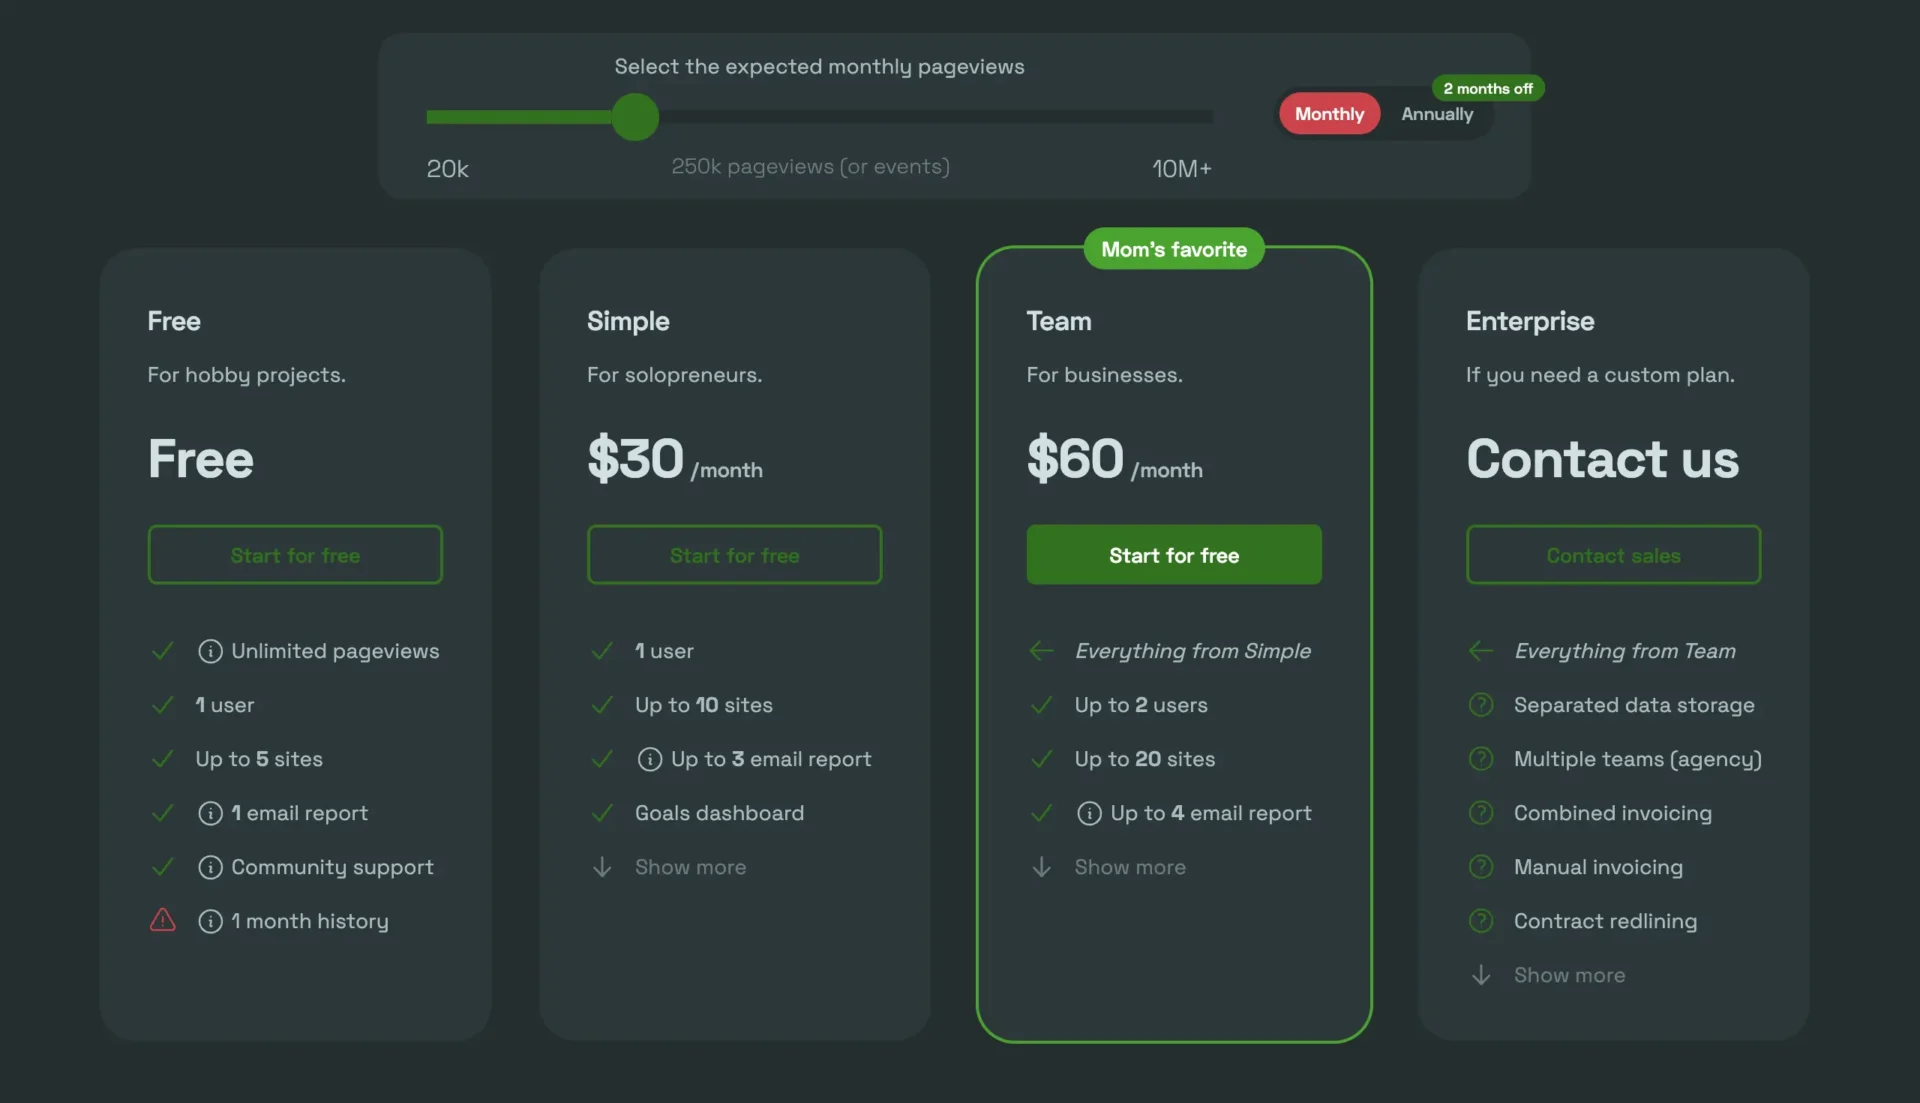
At this point, it makes sense to point something out that might be overlooked otherwise: page views are not unique user visits. That means that if one user accesses your website, clicks on “Contact”, and then checks out some other page, it’d total of 3 page views. Keep that in mind when deciding which plan to pick.
But no matter what plan you plan on purchasing, starting with a “Free” plan is always a good idea—and, frankly speaking, is quite generous when it comes to the features and limits it offers. One user, a maximum of five websites—that’s probably enough for most website owners who don’t expect they’re “building the next Facebook.” No, I’m not being fair, expectations like this usually come from clients.
The Features
Enough said. Let’s have a look at the features Simple Analytics offers and how well they actually work. Let’s go over the main and important features one by one, in alphabetical order to treat them equally.
AI: “No AI, No Cry”
AI, yeah… When ChatGPT 3.5 was released and everyone jumped on the hype train, I told my wife: “Wait a few weeks, then every website will have some kind of AI added.” Well, I wasn’t wrong, I think.
In all the time I’ve used Simple Analytics, at no point have I ever used its AI feature. I simply didn’t see the need to talk to a chatbot about… yes, about what, actually? The AI subpage gives some examples:
- Smart insights: Get amazing insights into your traffic
- Comparing visitors: Comparing visitors between weeks
- Traffic sources: Generate charts with grouped traffic sources Generate a Tweet Make a social media image of your data
Personally, those features fall into my “nice to have” category. I ended up simply not using the AI feature altogether. And AI has no reason to cry over that.
API: Your Data, Anywhere You Want
My technical background is in back-end development, so I was pleasantly surprised that SA offers an API for different use cases (showing statistics, export data, and admin actions). A simple one, of course.
However, since this API requires an API key (click here to get one if you’re already logged in) to be present in the requests header, you can’t simply add it as a URL parameter (e.g., ?=api_key=bla). You must add a header named Api-Key: followed by your, well, API key.
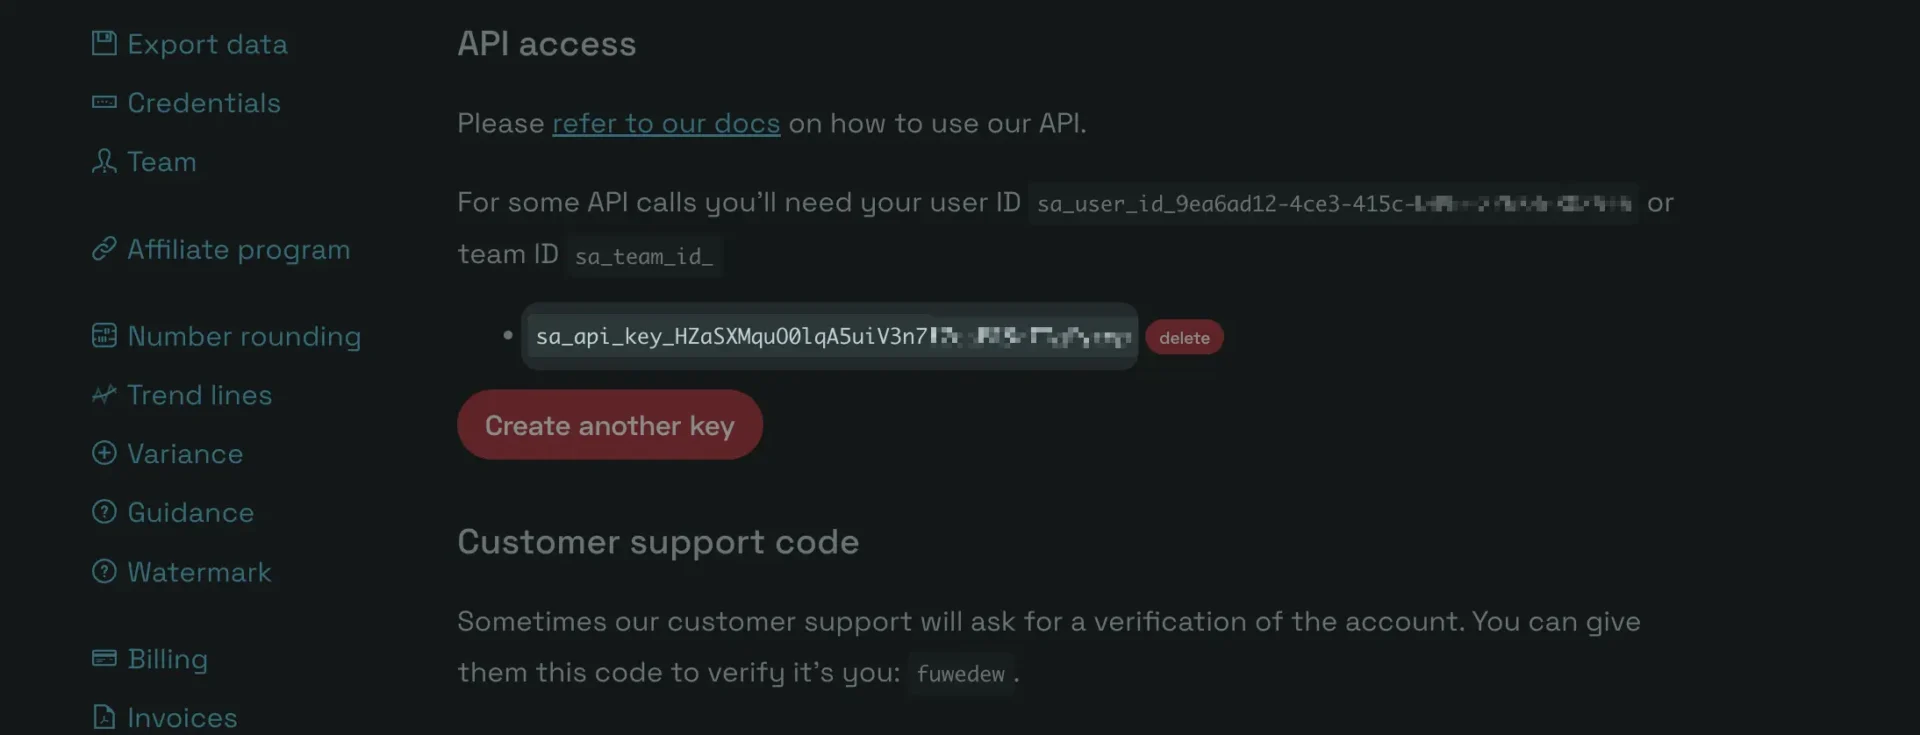
Another example of this is shown on SA’s documentation page:
Api-Key: sa_api_key_xxxxxxxxxxxxxxxxxxxxxxxxxxxxxxxxxxxxI really don’t want to make this review too technical, but if you’d like to test this, all you need is a command line (macOS’ native Terminal (🤮), iTerm2 (👍), or PowerShell for Windows, for example) and adjust the following request:
curl "https://simpleanalytics.com/example.com.json?version=5&fields=histogram" \
     -H 'Content-Type: application/json' \
-H 'Api-Key: sa_api_key_xxxxxxxxxxxxxxxxxxxxxxxxxxxxxxxxxxxx'So, once you’ve successfully authenticated your request and see some basic data and attach it to the GET request’s header and use the intuitively named RESTful API endpoints structured like this:
https://simpleanalytics.com/<YOUR DOMAIN>.json?version=5Obviously, you’ll need to add some field parameters to get the data you want. Conveniently, it tells you this in the direct JSON response:
Fields param is required to select the fields you need. Comma seperated. Available fields: pageviews, visitors, histogram, pages, countries, referrers, utm_sources, utm_mediums, utm_campaigns, utm_contents, utm_terms, browser_names, os_names, device_types, seconds_on_page.
To check what countries visitors of this blog, blog.kolja-nolte.com, come from, it’d be:
https://simpleanalytics.com/blog.kolja-nolte.com.json?version=5&fields=countriesConnecting to the API with cURL for the command line, this request looks like this:
curl "https://simpleanalytics.com/blog.kolja-nolte.com.json?version=5&fields=histogram&info=false" \
     -H 'Content-Type: application/json' \
-H 'Api-Key: sa_api_key_HZaSXMquO0lqA5uiVXXXXXXXXXXXXXXXX'And the output, if the API key is correct and the domain registered in your account:
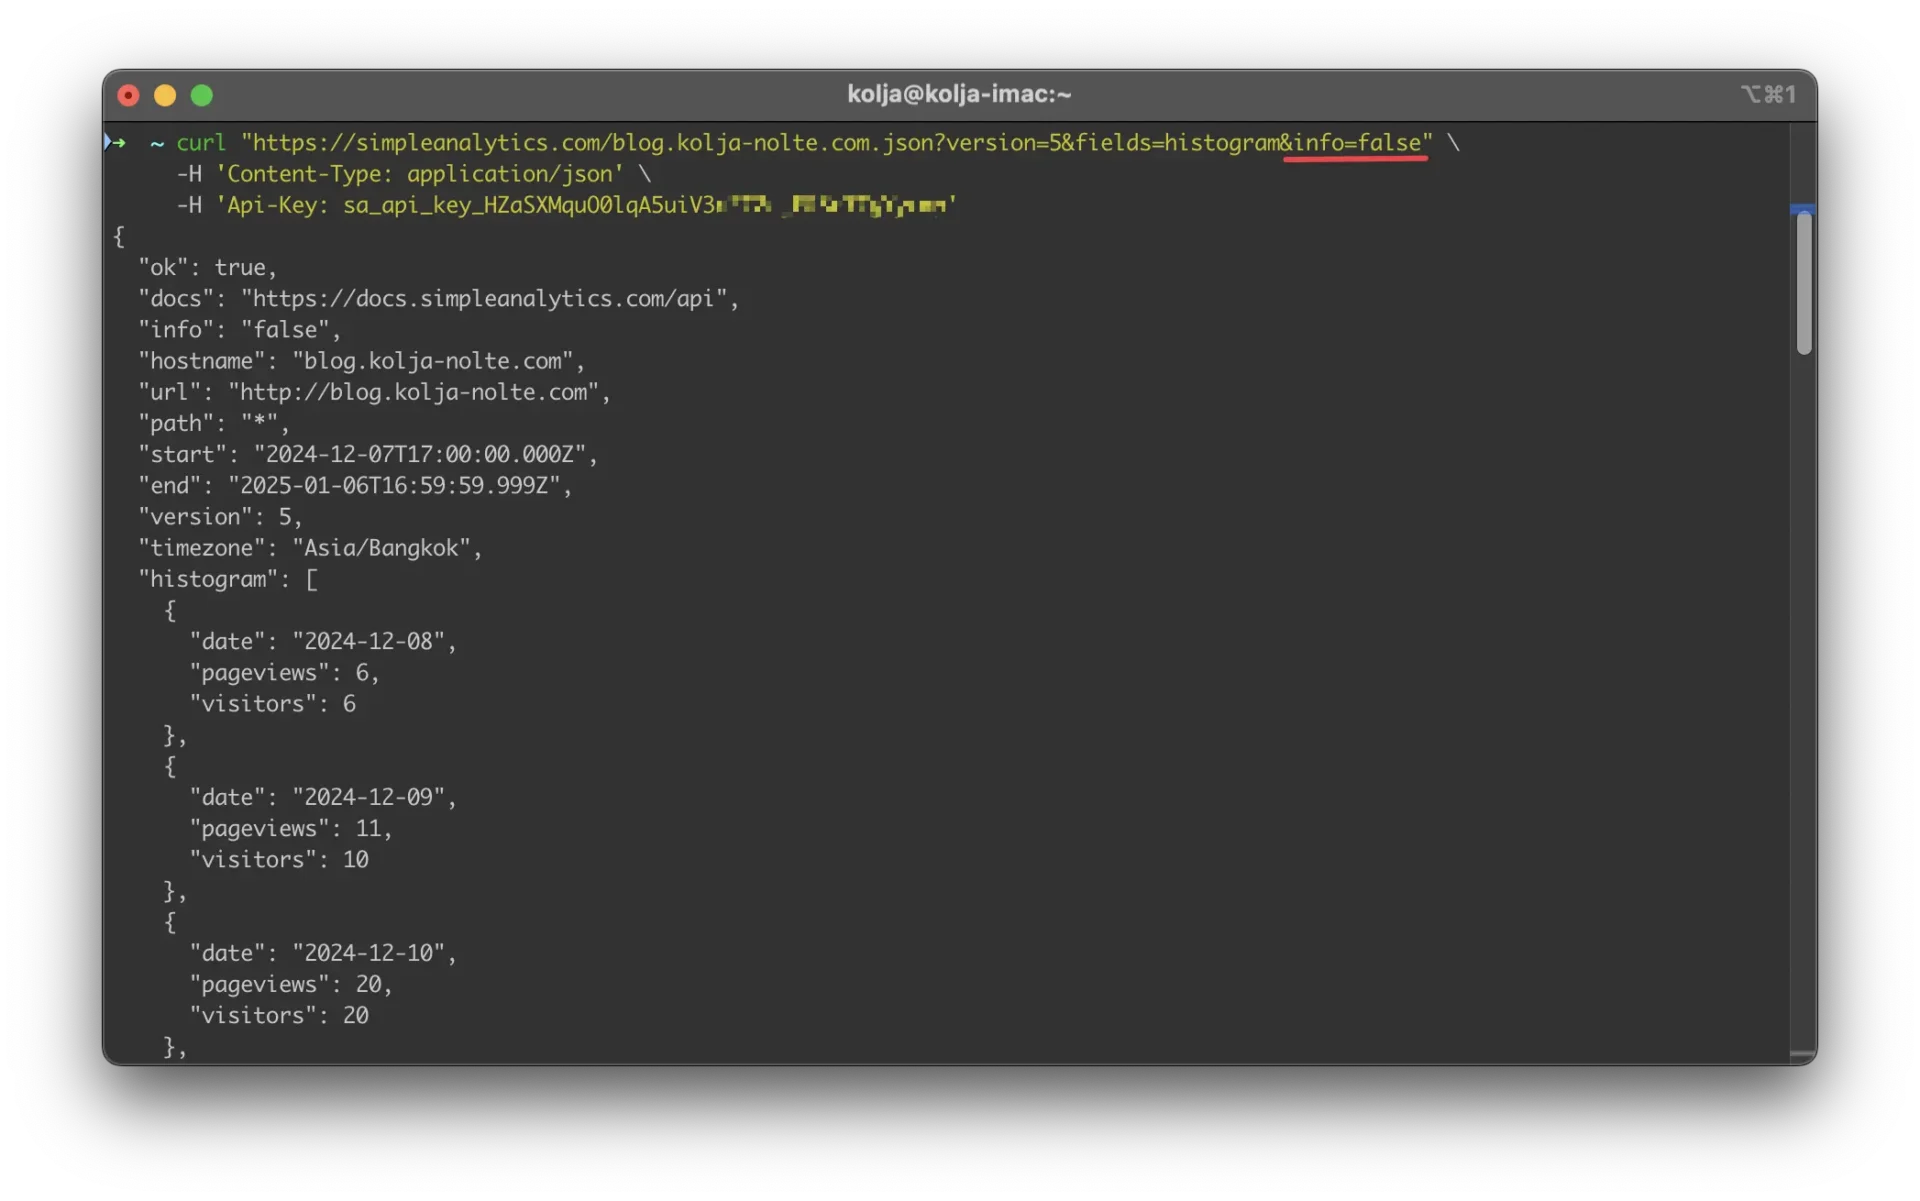
Yeah, these are this blog’s pathetically low visitor numbers; I can’t deny it. But rather than looking at the single-digit pageviews, have a quick look at the URL parameter I’ve added:
&info=falseIf you leave this away, you’ll get all kinds of helpful information, but to me, they’re Simply Annoying.
Of course, you can chain together more fields if necessary, separated by commas. All available query parameters and filters and anything else one might want to know is documented well on its documentation page.
With its RESTful API support, you can integrate your website data into basically anything. A button on your admin panel that shows how many page views you had yesterday? Here you go, copy and paste this into a .html file:
<script>
// Replace this with your added domain
const domain = 'simpleanalytics.com'

// Wait until page has loaded
document.addEventListener('DOMContentLoaded', async () => {
	const apiBaseUrl = `https://simpleanalytics.com/${domain}.json?version=5&fields=pageviews&start=yesterday`

  // Get data when the button is clicked
	document.getElementById('show-page-views')
  		.addEventListener('click', async () => {
  		  // Connect to Simple Analytics
  			await fetch(apiBaseUrl)
  				.then(response => {
  				  // Convert response into JSON format
  					return response.json()
  				})
  				.then(data => {
  				  // Display page views
  					alert(`Yesterday, you had ${data.pageviews} page views!`)
  			})
  	})
})
</script>Don’t forget the button:
<button id="show-page-views">Show Page Views</button>I ♥️ easy APIs!
A Number’s Game: The Statistics
See, now I’ve spent so much time on technical stuff that I almost forgot the most important feature of Simple Analytics: its analytics.
However, to be very honest here: there’s not that much to review. And that’s good, not bad. Whereas Google Analytics throws data at you that you can barely make sense of, SA keeps it simple and reduces its interface to only the most essential metrics.
Instead of listing every metric one by one, let me just show them to you, again, using my deserted blog as a reference:
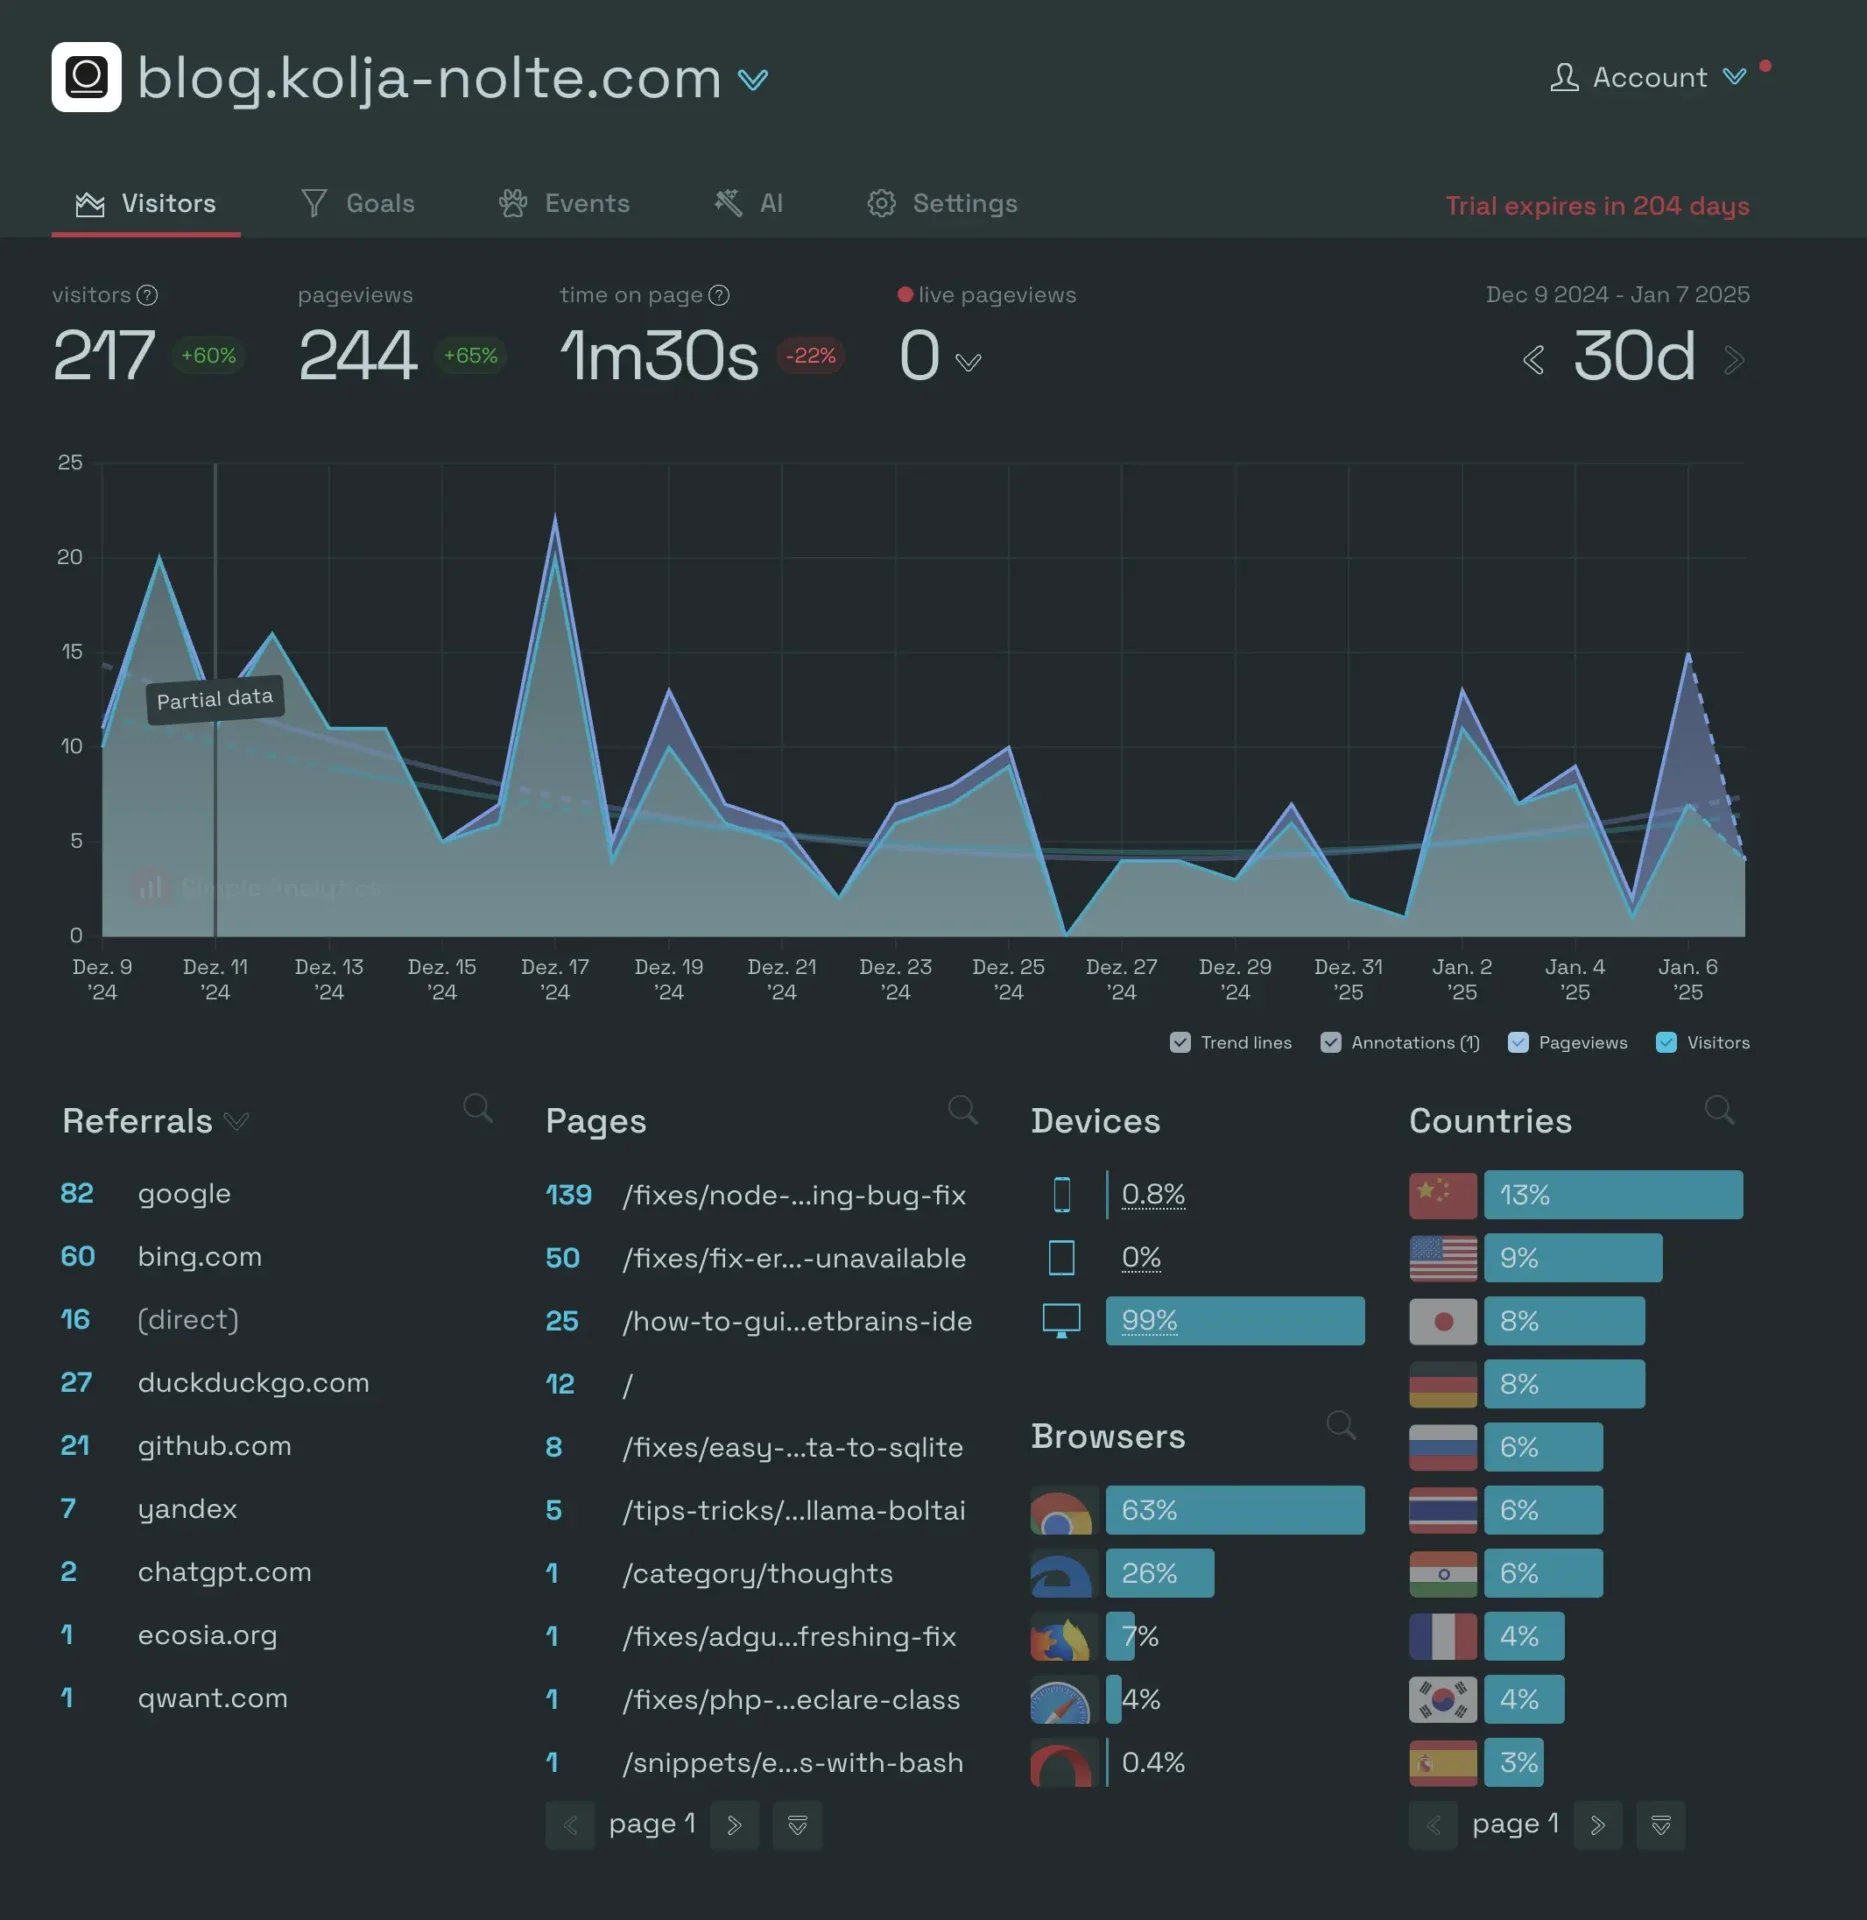
In this stylish dashboard, I have (almost) all the information I care about when I want to see how a website performs with the audience. Referrals (where they came from), Pages (what they saw), Devices, Browsers (Chrome on the top, obviously), and Countries.
I’m a little surprised that most users of my blog come from the People’s Republic of China (yes, dear Chinese, Taiwan, the Republic of China, does exist and is a sovereign country). If I click on the flag, the page structure remains, but the values change. At the moment, Chinese people seem to be quite interested in fixing a bug in Nuxt 3. If I were smart, I’d now create a Chinese version of this article and display it to users from China (GPT-4o and others are great when it comes to translating languages), but I’m not.
The same goes for all the other items. Clicking on a URL in the “Pages” column shows me the filtered analytical data for this specific URL. An important metric, from a web developer’s point of view, is the “Devices” column. That 99% of all my visitors use a desktop computer is definitely a statistical outlier since in November 2016 already it was found that “Mobile and tablet internet usage exceeds desktop for [the] first time worldwide.”4 In total, mobile devices are hovering around 55-60% while desktop users fall a little short.
What does that mean? Make your website responsive!
As you can see on the screenshot, you can also select specific timeframes. The “live pageviews” used to be a little buggy in the past, but this seems to have been fixed since then and is a fun way to stalk who’s currently on your site, what browser they use, and what page they’re on.
I can’t say much about Goals since I never had any. Most of my websites and the ones I create for clients don’t require the achievement of specific goals. SA’s documentation says about this feature:
Our goals feature is really helpful for organizing and understanding your data. With it, you can set up filters for your data and view the results in these cool goal cards. The cards make it easy to see how you’re doing at a glance.
They even have a video where they explain the use of this feature:
Be sure to check out the entire documentation page since it also contains a table of fields you’ll need in order to set up your goals.
Support
Getting in touch with actual humans (yes, I’m looking at you, chatbot!) is surprisingly easy. Which is kind of a sad thing to say, now that I think of it, but have you ever tried to contact Facebook, or Instagram, or any other website with a huge audience? It’s almost impossible for normal users. [email protected]? You wish!
I must admit, I’ve no idea how many people work at Simple Analytics—but it either must be a small-sized startup or just takes support seriously. I went deep into the rabbit hole called /team and found it out: Adriaan van Rossum (who seems to like putting up his table in the middle of a street and working from there), Iron Brand, and Carlo Cilento.
I’ve had one issue with the site not showing accurate information and asked the support for, well, support via email. In less than 24 hours I had a response, and the issue was resolved quickly.
No link to some convoluted help center, “have you tried to restart,” or some obscure ticketing system—and all that via email, which I always prefer. I’ve yet to run into deeper issues to be able to paint a full picture of their support, but from what I perceive, Simple Analytics is one of the few companies out there that actually do care about customer support. And I hope this stays this way.
Conclusion
Alright, it’s time to wrap this review up. I could pick apart their service for another couple of hours, but I don’t think I have to explain the obvious. Here’s a very subjective good vs. bad table:
| Good | Bad |
|---|---|
| Generous free tier | Referrals often show nothing at all |
| Overall simplicity | The “Events” feature isn’t very clear |
| Easy integration (with guides) | Unnecessary and slow AI chat |
| Excellent documentation | 🐸 |
| Awesome support | 🐖 |
(I really tried to come up with two more for the negative side, but I couldn’t ¯\_(ツ)_/¯)
Simple Analytics claims to be “the best Google Analytics alternative.” Is that true? No. Google Analytics is a beast, and those who can tame this monster can surely get a lot of benefits from its data to improve conversions, conduct A/B tests, and what else you can do with this monstrosity.
Simple Analytics, on the other hand, is no beast. And that’s by design—and also their core marketing strategy. That’s why I’m not even a huge fan of the claim that it should be “the best Google Analytics alternative.” It doesn’t have to be. Simple Analytics fills a not insignificantly small niche in the online analytics market, and that’s great.
I don’t want to click myself through a thousand pages of data, graphs, charts, and numbers that I have to look up in some “Help Center” to even understand them. I want to see how many people use my website, what pages are popular, and where they come from, displayed in a way that gives me all the vital information in a single view.
You know, simple.
Footnotes
- backlinko.com: “ChatGPT / OpenAI Statistics: How Many People Use ChatGPT” ↩︎
- firstpagesage.com: “Top Generative AI Chatbots by Market Share – November 2024” ↩︎
- simpleanalytics.com: Front page ↩︎
- gs.statcounter.com: “Mobile and tablet internet usage exceeds desktop for first time worldwide” ↩︎
